Automated reporting and custom business dashboards
Every number from every system you run, pulled on a schedule and turned into a live dashboard, a Monday digest and alerts that fire only when something needs you. You bring the brief and the brand. Everything after that is ours.
The whole reporting stack, built and run
Every source connected, every number defined once, and the result delivered three ways: a dashboard you open, a digest that arrives, an alert that finds you. Your accounts, your data, your logins.
- Every system, one placeCRM, accounting, ads, analytics and spreadsheets, pulled on a schedule into one store you own. No more copying between tabs.
- The live dashboardFilterable, always on, built around the numbers that change a decision. For whoever wants to dig into a figure.
- The Monday digestA written summary in your inbox or Slack before the week starts: what moved, by how much, and where to look.
- Alerts that fire when it mattersOne message when a number crosses a line you set, to the person who can act on it within the hour. Silence otherwise.
- Definitions written down onceWhat counts as a customer, which system wins when two disagree. Agreed at the start, applied to every report after.
- Runs on a schedule, not on a personOn a server, every Monday, holiday or not. Nobody opens a spreadsheet to make it happen.
Wired into everything you already run
Every source connected through your own accounts, so nothing leaves your property. Marketing and finance reporting are the same build pointed at different tables, and we run both.
- HubSpot
- Salesforce
- Xero
- QuickBooks
- Stripe
- Shopify
- Google Ads
- Meta Ads
- Google Analytics
- PostHog
- Google Sheets
- Airtable


Where the numbers come from, read through your own accounts.
- Looker Studio
- Power BI
- Supabase
- Vercel
- n8n
- Make
- MCP
- Claude
- Notion
- Slack
- Gmail


What we build and deliver it with: the dashboard in Looker Studio, Power BI or a custom build on Vercel, the store on Supabase, the schedule on n8n or Make, the digest written by Claude and delivered to Slack, Gmail or WhatsApp.
Fixed price, your accounts, yours to keep
Built once, run every week, owned by you.
The queries, the definitions, the schedule and the dashboard live in your accounts under your logins, and the business logic is written down rather than held in the head of one supplier. If we ever stop working together, nothing needs switching off and nothing needs rebuilding.
- Fixed price, quoted before anything starts
- One fixed price to build
- Your accounts, your logins
- Your data stays in your systems
The day-to-day, all of it automated
Fourteen jobs a specialist does by hand. The run does every one, on a schedule, inside the tools you already use. You see the results, not the work.
- Daily sales performance numbers consolidated automatically every night
- Financial cash flow forecasts updated using live balances
- Weekly summary drafted and sent to directors
- Dashboards configured to track operational and financial targets
- Data connections monitored continuously to prevent reporting errors
- Anomalies in daily revenue and costs alerted
- Team performance scores calculated and displayed on dashboards
- Departmental budget vs actual spend charts refreshed automatically
- Customer churn rates and lifetime values calculated monthly
- Cross-departmental data sources integrated into single truth views
- Managers alerted the moment a target slips
- Custom monthly board reporting packs generated with summaries
- Stock turnover rates and valuations tracked live
- Profit margin analysis broken down by product line
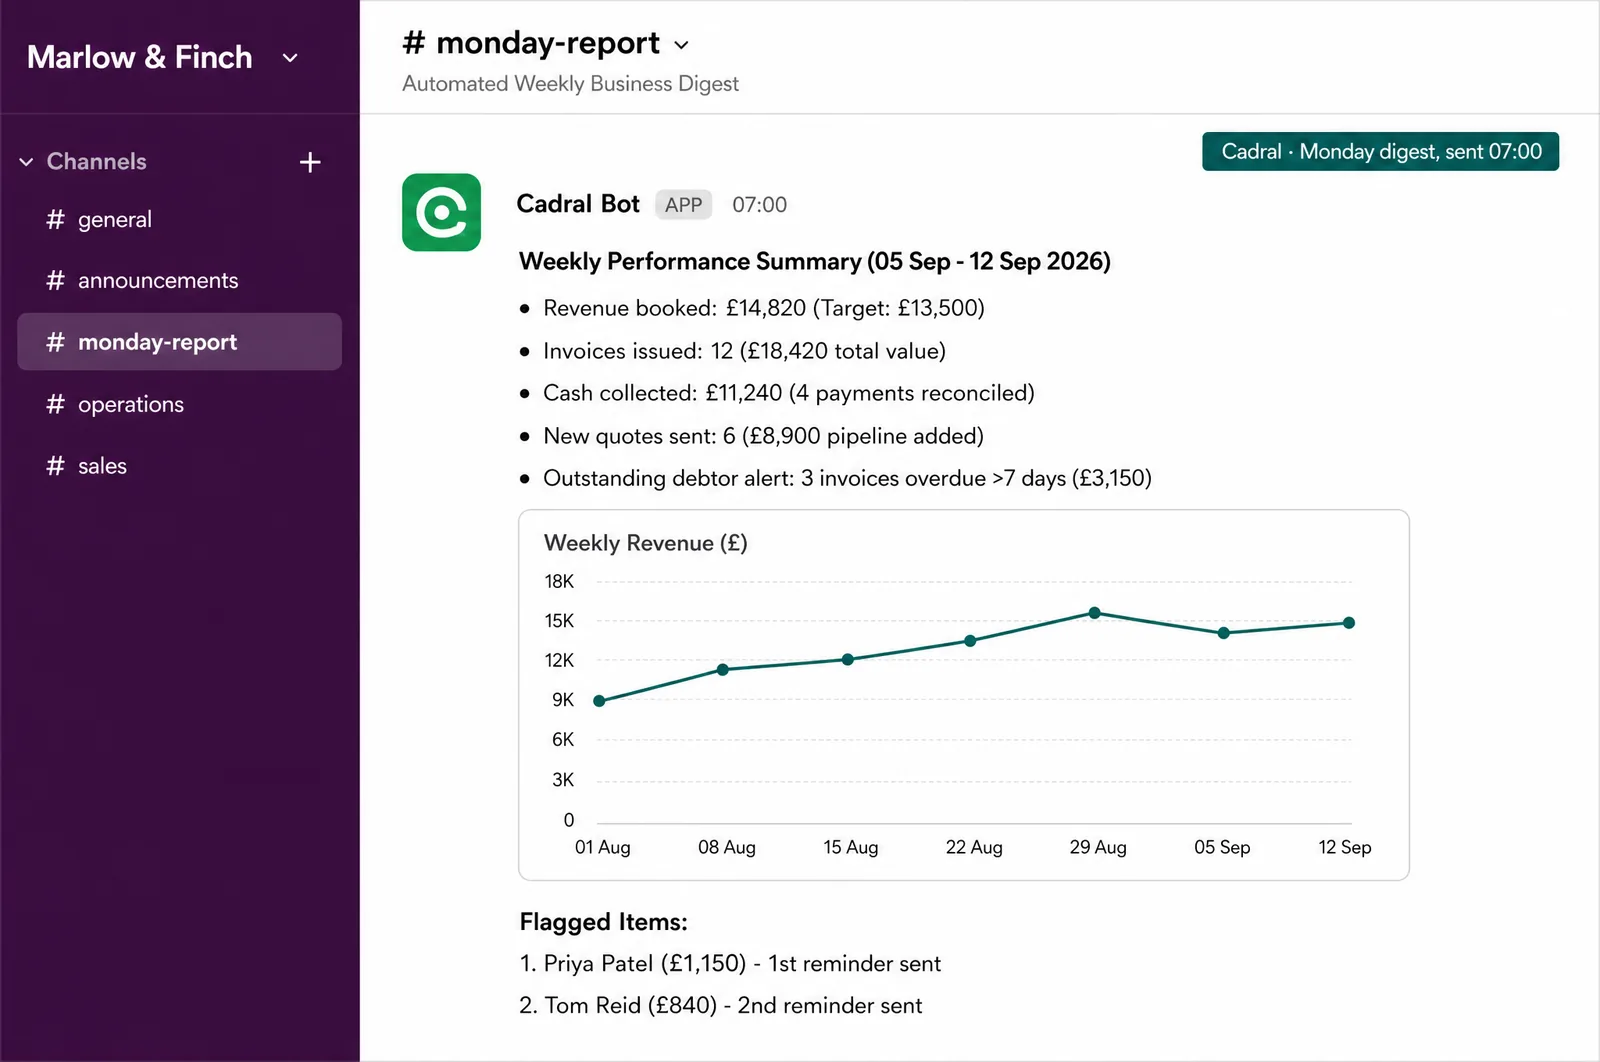
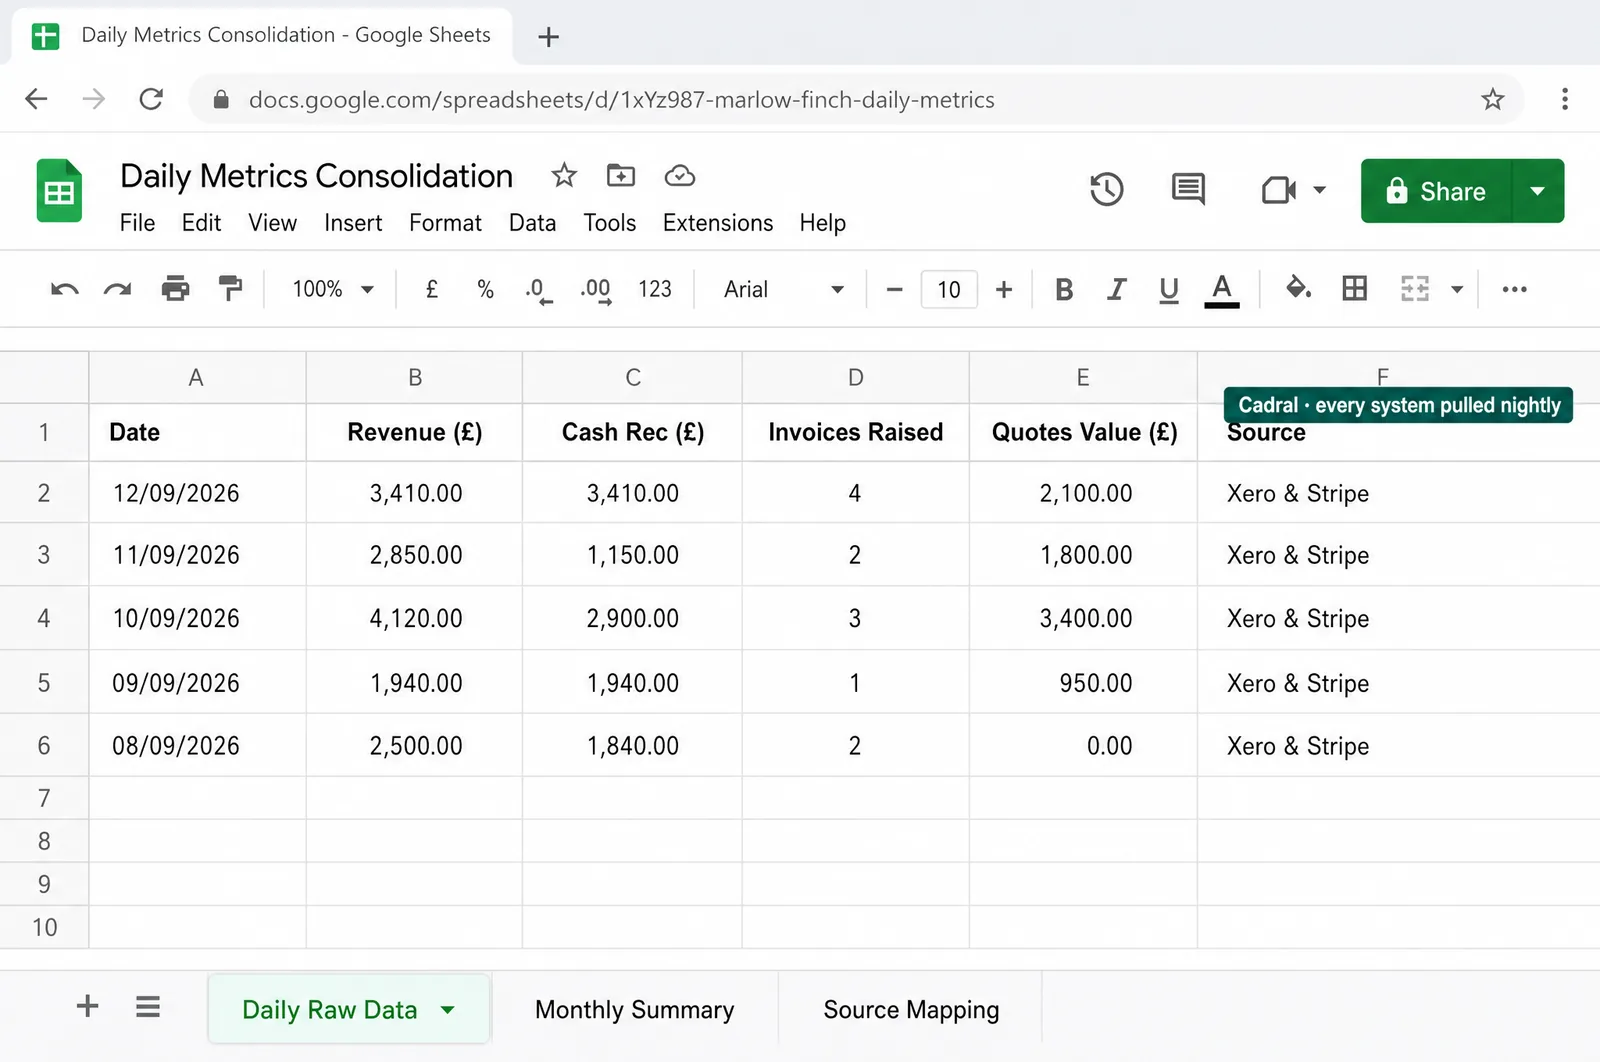
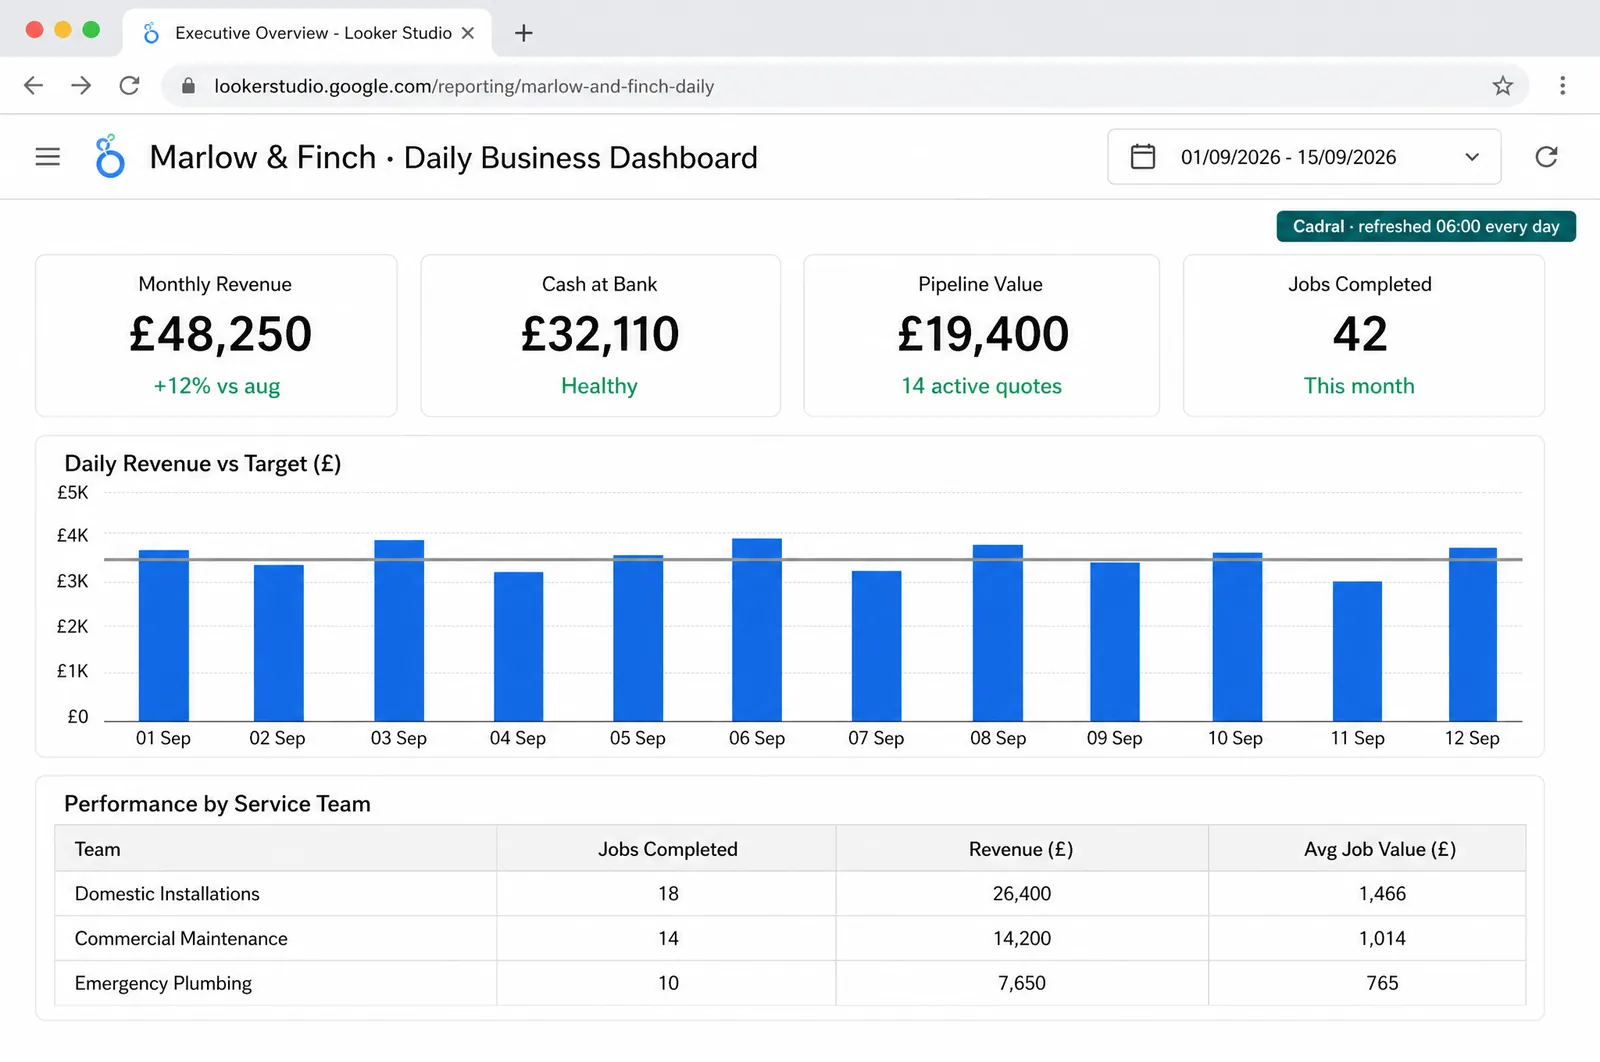
Illustrations of the tools in use, drawn for this page for an example business, Marlow & Finch. Every figure in them is an example, not a client's data, and any person in them is generated. Tap a picture to open it full size.
- Looker StudioThe live dashboard
- Power BISame job, Microsoft shops
- Google SheetsEvery number, pulled nightly
- SlackThe Monday digest
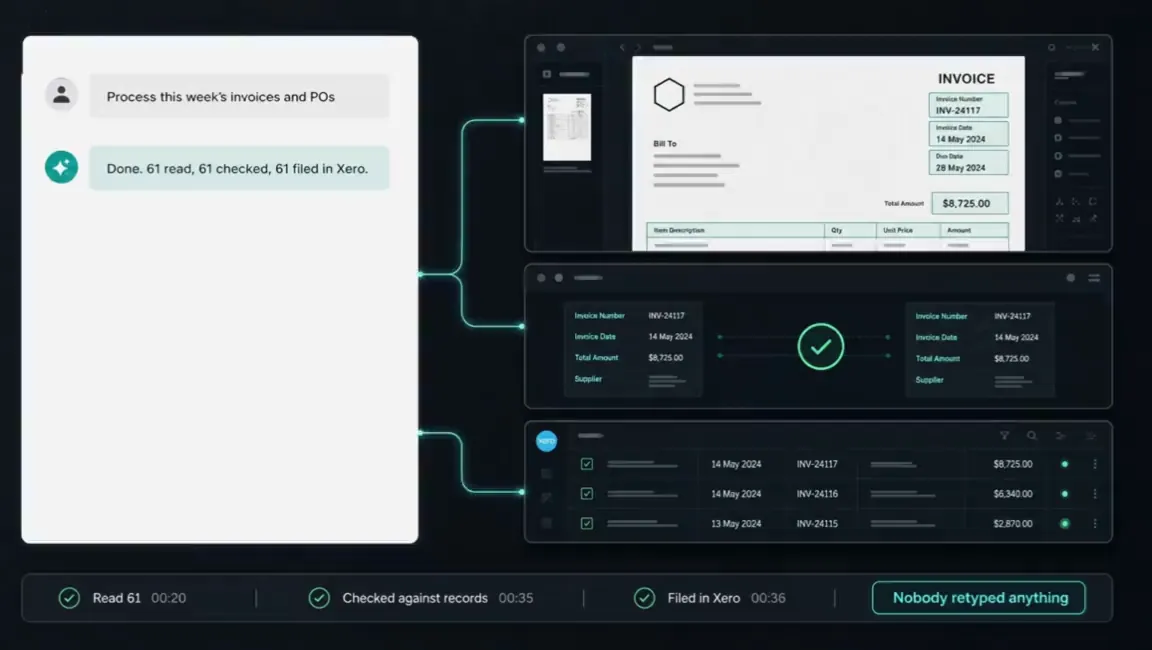
- XeroCash and revenue, live

The night shift
Nobody in the building. This is the job doing itself at eleven at night, and what you see in the morning.
Questions we get asked about this
- We already have dashboards nobody opens. Why would this be different?
- Because we build the push as well as the pull. The digest lands in your inbox or Slack on Monday morning and says what moved in plain English, and the alert reaches the right person the hour a number crosses a line. The dashboard is there for whoever wants to dig into what the digest mentioned. Nobody has to remember to open anything.
- Our numbers live in six different systems. Can you join them up?
- Yes, and that is the part we do. Each source is connected through your own accounts, the definitions are agreed once (what counts as a customer, which system wins when two disagree) and written down, and every report after that uses the same rules. One answer per question, the same answer every week.
- Can it explain the numbers, not just show them?
- Yes. The digest says what moved, by how much, against what that line normally does, and which records drove the change. A fall in enquiries is traced to the source it came from and the week it started, so whoever reads it knows where to look before the meeting.
- Who owns it if we stop working together?
- You do. The queries, the definitions, the schedule and the dashboard all live in your accounts under your logins, and the business logic is written down rather than held in the head of one supplier. Nothing of ours needs switching off.
- What do you need from us?
- The brief (which decisions the report should drive), the brand (so it looks like yours), and access to the systems the numbers live in. Everything after that is us.
Got a question the list did not answer? Ask it on a call, or send us the brief and we will come back with a fixed price.
What usually gets built alongside it
The report is only as good as the records it reads. These are the builds that keep those records clean, and they usually go in alongside it.
Tell us the job. We will tell you the price.
Twenty minutes and a fixed quote in writing. You bring the brief and the brand. Everything after that is us.
Not ready to talk? Run your own numbers on fifteen free tools, no email asked.
Elsewhere on this site
Each service is its own page. Pricing, the FAQ, the Manchester company page, the free tools and the blog sit alongside them.
Services
- SEO automation
- Content production
- Social media automation
- Brand and video production
- Paid ads automation
- Email marketing automation
- Lead qualification
- CRM automation
- Outbound automation
- AI voice agents, outbound
- Proposals and quotes
- Inbound automation
- AI chat widget
- AI voice agents, inbound
- WhatsApp and SMS
- Document processing
- Invoicing and payment chasing
- Reporting and dashboards
- Scheduling and onboarding
- Recruitment and HR
- Website design and build
- Custom software and apps
- AI agent development
- System integration
- Knowledge base and search
- Your whole stack, inside Claude
- Team training and upskilling
- AI strategy and roadmap
- Support and maintenance
